

Reducing your largest Contentful Paint asset and enabling server-side caching will deliver the fastest, most measurable gains. Those two changes address the most common bottlenecks found in Australian site audits: oversized hero images and uncached responses that force every visitor to wait for a full server round-trip. From there, a short sequence of targeted actions will move Core Web Vitals scores in the right direction without requiring a full rebuild.
The highest-impact, lowest-effort actions to take first:
- Compress and serve images in WebP or AVIF format, with responsive
srcsetmarkup so mobile devices receive appropriately sized files. - Enable HTTP caching headers and connect a content delivery network (CDN) so assets are served from an edge node close to the visitor.
- Defer or load asynchronously any JavaScript that is not needed to render the initial view.
- Remove or delay third-party scripts (analytics tags, chat widgets, social embeds) that block the main thread.
- Minify CSS and JavaScript files and combine where the HTTP/2 overhead does not outweigh the benefit.
- Set explicit
widthandheightattributes on images to prevent layout shift (CLS).
Two checks to run right now: paste your URL into Google PageSpeed Insights for a Lighthouse lab report, then open the Core Web Vitals report in Google Search Console to see field data from real visitors via the Chrome User Experience Report (CrUX).
Pro Tip: Do not optimise for a higher Lighthouse score in isolation. A synthetic score can improve while real-user metrics stay flat if the test URL is not representative of your busiest, heaviest pages. Always cross-reference lab results with CrUX field data before declaring a fix successful.
Table of Contents
- Why does website performance matter for your organisation?
- How do you measure website speed accurately?
- Which tools should you use to test and monitor performance?
- What are the highest-impact fixes, and in what order?
- How should you run a performance audit from start to finish?
- What do performance fixes typically cost and how long do they take?
- How do you monitor performance over time?
- Sustainable, accessible performance: an Australian governance perspective
- How does your hosting environment affect performance?
- Key takeaways
- Performance as stewardship, not a project
- Marzipan’s performance and web services for Australian organisations
- Useful sources and tools for further reading
Why does website performance matter for your organisation?
Website performance covers three dimensions: how quickly a page loads its main content (loading speed), how quickly it responds to user input (interactivity), and how stable the layout is as assets arrive (visual stability). Google’s Core Web Vitals framework formalises these as Largest Contentful Paint (LCP), Interaction to Next Paint (INP), and Cumulative Layout Shift (CLS).
The business case is straightforward. Slow pages increase abandonment, reduce conversions, and signal lower quality to search engines. For mission-driven organisations, there is an additional dimension: a slow or unstable page excludes visitors on low-bandwidth connections or older devices, which directly undermines accessibility commitments. Accessible pages that prioritise content and remove unnecessary assets tend to load faster as a direct consequence of good content structure.
Key outcomes linked to strong performance:
- Lower bounce rates as visitors reach usable content before losing patience.
- Higher conversion rates on donation pages, service enquiry forms, and e-commerce checkouts.
- Improved organic search rankings, since Core Web Vitals are a confirmed Google ranking signal.
- Reduced reputational risk: a slow government or charity site signals poor digital stewardship to stakeholders and auditors.
- Broader accessibility, particularly for regional Australian users on mobile networks with higher latency.
One finding worth noting for Australian organisations: the ACCC’s Measuring Broadband Australia programme found that upgrading an end-user’s NBN speed tier produced only marginal improvement in web browsing performance. Site design, object count, and third-party dependencies had greater impact than connection speed. Investing in a faster hosting plan or encouraging users to upgrade their broadband is not the answer; reducing what the page asks the browser to fetch is.
Mobile traffic accounts for a substantial share of Australian web visits, and mobile users on 4G connections experience higher latency than desktop users on fixed broadband. Testing on a simulated mobile connection and prioritising mobile Core Web Vitals scores is not optional for organisations that serve the general public.
How do you measure website speed accurately?
The metrics to track are LCP, INP, and CLS as primary Core Web Vitals, supported by First Contentful Paint (FCP), Time to First Byte (TTFB), total transfer size, and total request count. Together these give a complete picture of loading, interactivity, and stability.

Lab data versus field data is the most important distinction in performance measurement. Lab data (Lighthouse, WebPageTest, GTmetrix) runs a controlled test from a fixed network and device profile. It is reproducible and diagnostic. Field data (CrUX, real-user monitoring) reflects what actual visitors experience across their varied devices, locations, and network conditions. Both are necessary: lab data tells you what to fix; field data tells you whether the fix worked for real users.
Google’s guidance is to assess Core Web Vitals at the 75th percentile of field sessions, meaning 75% of your visitors should meet the threshold. Optimising only for the median can leave a quarter of your audience with a poor experience.
| Metric | What it measures | Good threshold | Lab or field | Diagnostic use |
|---|---|---|---|---|
| LCP | Time until the largest visible content element loads | ≤ 2.5 s | Both | Identifies slow hero images or large text blocks |
| INP | Delay between user input and next visual response | ≤ 200 ms | Field (CrUX) | Flags heavy JavaScript blocking interaction |
| CLS | Cumulative layout shift during page load | ≤ 0.1 | Both | Detects missing image dimensions or late-loading fonts |
| FCP | Time to first visible content | — | Both | Early signal of render-blocking resources |
| TTFB | Time from request to first byte from server | ≤ 800 ms | Both | Diagnoses slow server, hosting, or CDN configuration |
| Transfer size | Total page weight in kilobytes | Contextual | Lab | Flags uncompressed or unoptimised assets |
| Requests | Total HTTP requests per page | Contextual | Lab | Reveals excessive dependencies |
Core Web Vitals thresholds are the standard reference for LCP ≤ 2.5 s, INP ≤ 200 ms, and CLS ≤ 0.1.
Pro Tip: Run separate tests for mobile and desktop, and choose three to five representative URLs: your homepage, your highest-traffic landing page, and your most conversion-critical page (for example, a donation form or service enquiry). A homepage-only audit routinely misses the pages where performance problems cost the most.
Which tools should you use to test and monitor performance?
The recommended toolset for most Australian organisations is: PageSpeed Insights (Lighthouse) for quick audits, WebPageTest for waterfall analysis, GTmetrix for scheduled monitoring, and CrUX via Google Search Console for real-user field data. No single tool covers every need.

| Tool | Lab or RUM | Difficulty to act on | Cost | Primary use-case | Expected impact / time to improve |
|---|---|---|---|---|---|
| PageSpeed Insights / Lighthouse | Lab + CrUX field | Owner (no code needed to read) | Free | One-off audit, quick diagnosis | High / same day for quick wins |
| WebPageTest | Lab (waterfall) | Developer | Free (public instance) | Deep waterfall and dependency analysis | High / 1–5 days per fix cycle |
| GTmetrix | Lab + scheduled | Owner to developer | Free tier; paid plans available | Scheduled monitoring, before/after comparison | Medium–high / ongoing |
| Google Search Console (CrUX) | Field (RUM) | Owner | Free | Real-user Core Web Vitals, URL-level field data | Directional / 28-day rolling |
| Chrome DevTools | Lab | Developer | Free | In-browser profiling, network waterfall | High / immediate diagnosis |
For Australian sites, test location matters. WebPageTest allows you to select a Sydney or Melbourne test node, which gives a more realistic TTFB reading than a test run from a US server. CDN edge coverage in Australia varies by provider; confirm that your CDN has Australian points of presence before assuming it will reduce latency for local visitors.
Two specialised workflows worth building into your process:
- Waterfall analysis with WebPageTest: run a test from a Sydney node, export the waterfall chart, and identify the single longest dependency chain. That chain, not the total page weight, is usually the binding constraint on LCP.
- Continuous alerts with a RUM provider: connect Google Search Console’s Core Web Vitals report to a weekly review cadence. For higher-traffic sites, a dedicated RUM tool (such as those built into Cloudflare or available via open-source options) can alert you when field INP or LCP degrades after a release.
What are the highest-impact fixes, and in what order?
The largest measurable gains come from seven areas, roughly ordered by impact relative to effort. Address server response time and images first; they affect every page and every visitor.
1. Server response time and origin performance
A TTFB above 800 ms means every subsequent metric is delayed before the browser has received a single byte. Check your hosting tier, enable keep-alive connections, and confirm your web server is using HTTP/2 or HTTP/3. For WordPress and similar CMS platforms, enable full-page caching at the server level (not just browser caching).
2. CDN and caching
Serve static assets from a CDN with Australian edge nodes. Set Cache-Control headers so browsers cache assets locally. A cache hit ratio below 80% on static assets suggests misconfigured headers. Cloudflare’s free tier covers basic CDN and caching for most small organisations and has Australian points of presence.
3. Image and media optimisation
Images are the single most common cause of a slow LCP. The GovCMS best practice guidance and Queensland Government’s online file standards both recommend resizing, compressing, and serving images in modern formats as a priority fix.
Steps for image optimisation:
- Audit every image on your key pages using the Lighthouse “Opportunities” panel.
- Resize images to the maximum display dimensions; do not serve a 3,000 px wide image in a 600 px column.
- Compress images using a tool such as Squoosh, ImageOptim, or your CMS’s built-in optimiser.
- Convert to WebP (broad browser support) or AVIF (better compression, slightly less support).
- Add
srcsetandsizesattributes so browsers request the appropriately sized file for the viewport. - Apply
loading="lazy"to all images below the fold; do not lazy-load the LCP image.
4. Render-blocking resources
JavaScript and CSS that load in the <head> without defer or async attributes block the browser from rendering anything until they finish downloading and parsing. Audit render-blocking resources in the Lighthouse report and apply defer to non-critical scripts. Extract critical CSS (the styles needed for above-the-fold content) and inline it; load the rest asynchronously.
Steps for JavaScript and CSS:
- Identify render-blocking scripts in the Lighthouse “Opportunities” section.
- Add
deferto scripts that do not need to run before page render. - Add
asyncto independent scripts (analytics, chat) that have no dependencies. - Use code splitting to load only the JavaScript needed for the current page.
- Inline critical CSS and load non-critical stylesheets with
media="print"and a JavaScript swap.
5. Third-party script governance
Third-party scripts (tag managers, social embeds, advertising pixels, live chat) are a common source of both INP degradation and LCP delay. A waterfall audit will show which third-party domains are on the critical path.
Governance rules for third-party scripts:
- Audit all active tags in your tag manager quarterly; remove any that are no longer in use.
- Load non-critical third-party scripts after the
loadevent or withdefer. - Use a tag manager’s built-in trigger conditions to fire scripts only on pages where they are needed.
- Set a removal threshold: any script that adds more than 500 ms to LCP on mobile without a clear business justification should be removed or replaced.
6. Font loading
Web fonts block rendering if not loaded carefully. Use font-display: swap so text renders in a fallback font while the web font loads. Preload the one or two font files used above the fold using <link rel="preload">. Self-host fonts where possible to avoid a DNS lookup to a third-party font CDN.
7. Code and asset hygiene
Minify HTML, CSS, and JavaScript. Enable Gzip or Brotli compression at the server level. The Queensland Government’s online file optimisation standards require that all web assets, including PDFs and scripts, be optimised for size before publishing.
Pro Tip: Use an impact-versus-effort matrix before starting any sprint. Plot each identified fix on a two-axis grid (impact on Core Web Vitals on one axis, developer effort in days on the other). Address the high-impact, low-effort quadrant first. This prevents teams from spending a week on a fix that moves LCP by 50 ms while a five-minute image compression task would have moved it by 800 ms. Re-run your baseline test after each grouped change, not after each individual file edit, to keep the feedback loop manageable.
How should you run a performance audit from start to finish?
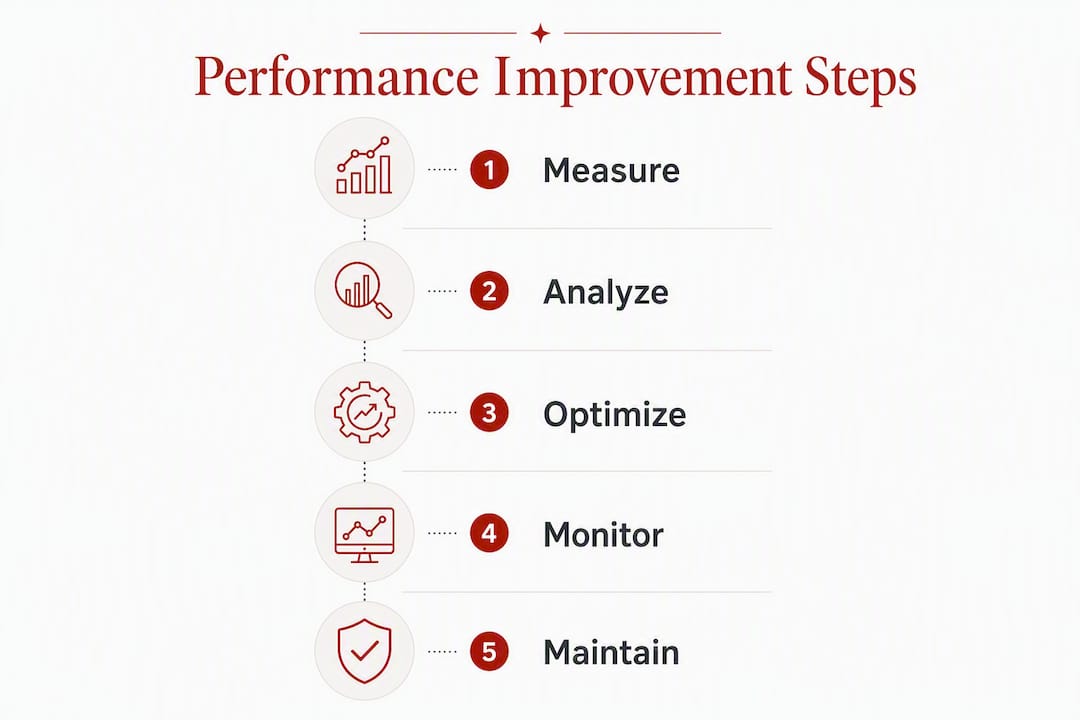
The four-step cycle is: establish a baseline, diagnose the primary bottleneck, implement a targeted fix, then re-test under the same conditions and monitor. The GovCMS iterative guidance recommends this staged approach across discovery, alpha, beta, and live phases, with measurement at each step to catch regressions before they reach production.
Audit checklist:
- Select three to five representative URLs (homepage, top landing page, conversion page).
- Run Lighthouse on each URL in mobile mode and desktop mode separately.
- Pull CrUX field data from Google Search Console for the same URLs.
- Run a WebPageTest waterfall from a Sydney or Melbourne node.
- Capture screenshots and export waterfall charts for the record.
- Note the 75th-percentile LCP, INP, and CLS from field data as the baseline.
Diagnostic signal map:
| Symptom | Likely cause | Remedy |
|---|---|---|
| TTFB > 800 ms | Slow server, no caching, distant origin | Upgrade hosting tier, enable full-page cache, add CDN |
| LCP > 2.5 s | Oversized or unoptimised hero image | Compress, resize, convert to WebP, preload LCP image |
| LCP > 2.5 s (image already optimised) | Render-blocking JS or CSS | Defer scripts, inline critical CSS |
| INP > 200 ms | Heavy JavaScript on main thread | Code split, defer non-critical JS, audit third-party scripts |
| CLS > 0.1 | Missing image dimensions, late font swap | Add width/height attributes, use font-display: swap |
| High transfer size | Uncompressed assets, unused CSS/JS | Enable Brotli/Gzip, tree-shake unused code |
Workflow steps:
- Run the baseline audit and record all metrics in a shared document with date and test conditions.
- Identify the single largest bottleneck from the diagnostic map above.
- Implement the corresponding fix in a staging environment.
- Re-run the same tests under the same conditions (same tool, same node, same URL).
- Compare before-and-after screenshots and waterfall charts.
- Merge to production only when the fix shows a measurable improvement without regressions elsewhere.
- Monitor field data for 28 days post-release to confirm the improvement holds for real users.
Recordkeeping discipline matters here. Version your test results in a spreadsheet or project management tool, attach before-and-after screenshots to each ticket, and close tickets only when the field data confirms the change. This prevents scope creep and gives governance teams an auditable trail.
What do performance fixes typically cost and how long do they take?
The honest answer is that timelines and costs vary considerably depending on CMS complexity, the number of third-party integrations, and whether the work is done in-house or by a contractor. The table below gives realistic ranges for common fix categories.
Small organisations (in-house team or agency contractor, single CMS template):
- Image compression and format conversion: one to two days of effort; negligible tool cost if using free compressors.
- Enabling CDN and caching (for example, Cloudflare free tier): half a day to configure; free at entry level.
- Deferring third-party scripts via tag manager: one day; no additional cost if a tag manager is already in place.
- Font loading optimisation: half a day; no cost beyond developer time.
- Full render-blocking audit and CSS/JS refactor: three to five days; cost depends on developer rate.
Larger or enterprise organisations (multiple templates, governance review, accessibility and security checks):
- Image pipeline and responsive image implementation across all templates: one to three weeks.
- CDN configuration with custom rules and cache invalidation workflows: one week plus ongoing management.
- JavaScript architecture review and code splitting: two to six weeks depending on framework complexity.
- Full performance sprint (audit, prioritise, implement, test, document): four to eight weeks with a dedicated developer.
Procurement and governance add time for government agencies and high-trust organisations. Accessibility checks (WCAG 2.1 AA compliance) and security reviews are not optional extras; they are part of the delivery standard and should be scoped into every performance sprint from the outset.
One realistic expectation: a well-scoped image optimisation and caching sprint for a mid-sized WordPress site typically moves LCP from the “needs improvement” band (2.5–4 s) to the “good” band (under 2.5 s) within two to three weeks of focused work. More complex front-end refactors take longer and carry higher regression risk, which is why the iterative, one-change-at-a-time approach described above is worth the discipline.
How do you monitor performance over time?
The recommended KPI set for a governance dashboard is: 75th-percentile LCP, 95th-percentile INP, CLS, total page weight, total request count, cache hit ratio, and uptime/availability. These metrics together cover loading, interactivity, stability, and infrastructure health.
The Digital Transformation Agency expects teams to embed performance measurement into service governance and treat it as an ongoing indicator of service health, not a one-off audit exercise. The Digital Service Standard requires services to establish baselines, identify meaningful indicators, and schedule regular assessments.
Monitoring mix:
- Daily synthetic checks (Lighthouse CI or a scheduled GTmetrix report) to catch regressions introduced by CMS updates, plugin changes, or content edits.
- Continuous RUM via CrUX (Google Search Console) or a dedicated tool to track real-user field data on a rolling 28-day basis.
- Release gates: run a Lighthouse audit in your deployment pipeline before merging to production; fail the build if LCP or CLS regresses beyond a defined threshold.
- Monthly governance review: compare current 75th-percentile field metrics against the baseline and document any changes with their cause.
KPI monitoring reference:
| KPI | Data source | Suggested alert threshold |
|---|---|---|
| LCP (75th percentile) | CrUX / RUM | Alert if > 2.5 s |
| INP (95th percentile) | CrUX / RUM | Alert if > 200 ms |
| CLS | Synthetic + CrUX | Alert if > 0.1 |
| Page weight | Synthetic (Lighthouse) | Alert if > 20% increase week-on-week |
| Request count | Synthetic (Lighthouse) | Alert if noticeable increase week-on-week |
| Cache hit ratio | CDN dashboard | Alert if < 80% on static assets |
| Availability | Uptime monitor | Alert if < 99.5% over 24 hours |
Pro Tip: Set alert thresholds at rolling percentiles, not point-in-time readings. A single slow test result can be caused by a transient network issue; a sustained shift in the 75th-percentile LCP over seven days is a genuine signal. Use a seven-day rolling average for synthetic alerts to reduce noise without masking real regressions.
Sustainable, accessible performance: an Australian governance perspective
Marzipan prioritises accessible and sustainable optimisation that reduces page weight without sacrificing usability or inclusion. This is not a values statement in tension with performance work; it is the same work, approached with a wider set of criteria.
The ACCC’s broadband performance research confirms that site design and object count matter more than connection speed. Reducing page weight helps visitors on regional Australian mobile networks just as much as it reduces the carbon cost of serving each page. Fewer large images, leaner markup, and prioritised content are good for speed, good for accessibility, and good for the environment.
Governance-aligned performance work means establishing a baseline before any change, choosing metrics that reflect real user outcomes, and scheduling assessments at defined intervals. The Digital Service Standard Version 2.0 and the Digital Performance Standard both require this discipline for Australian government digital services. Purpose-driven organisations outside government benefit from the same rigour: it produces auditable evidence of improvement and prevents the common pattern of optimising for a score rather than for the people using the service.
For Australian not-for-profits and community organisations, the intersection of accessibility and performance is particularly direct. WCAG 2.1 AA compliance encourages content prioritisation, clear structure, and the removal of decorative or redundant assets. These same practices reduce page weight and improve LCP. An organisation that audits for accessibility and performance together, rather than sequentially, typically completes both workstreams faster and with fewer regressions.
Pro Tip: When presenting performance trade-offs to a board or senior leadership team, use a one-page metric memo: current 75th-percentile LCP and CLS, the proposed fix, the expected change, the effort required, and the accessibility or sustainability co-benefit. Decision-makers in high-trust organisations respond to evidence and co-benefits, not to technical scores alone.
How does your hosting environment affect performance?
Hosting is the foundation. A well-optimised page served from an underpowered or geographically distant server will still produce a slow TTFB, and every other metric follows from that first byte.
To analyse your hosting environment, start with TTFB. A consistent TTFB above 800 ms from an Australian test node points to one of three causes: the server is under-resourced for the traffic it receives, the origin is geographically distant (for example, a US-hosted server serving Australian visitors), or the application layer (CMS, database queries, PHP processing) is slow before it sends a response.
Steps to assess and improve your hosting infrastructure:
- Run a WebPageTest from Sydney with connection throttling disabled to get a clean TTFB reading from an Australian network.
- Check whether your hosting plan includes server-side caching (object cache, full-page cache). Shared hosting plans often do not; managed WordPress hosting plans typically do.
- Confirm the physical location of your primary server. If it is outside Australia, evaluate whether migrating to an Australian data centre or adding a CDN with Australian edge nodes would reduce TTFB.
- Review your CMS’s database query performance. Slow queries are a common cause of high TTFB on content-heavy sites; a query monitor plugin (for WordPress, Query Monitor is a standard diagnostic tool) will surface the worst offenders.
- Assess whether HTTP/2 or HTTP/3 is enabled. Both protocols reduce the overhead of multiple concurrent requests, which matters when a page loads many small assets.
- For organisations with predictable traffic spikes (for example, a charity running an annual appeal or a government agency publishing a major report), confirm that your hosting plan can scale horizontally or that you have a CDN in place to absorb the load.
Upgrading a hosting plan is sometimes the right answer, but it should follow a diagnostic process, not precede it. The ACCC’s broadband research finding applies equally to server-side bandwidth: throwing more resources at the problem without identifying the actual bottleneck rarely produces proportionate gains.
Key takeaways
Reducing LCP and enabling caching are the two changes that deliver the fastest, most measurable improvement to website performance for Australian organisations.
| Point | Details |
|---|---|
| Start with LCP and caching | Compress and convert your hero image to WebP, then enable server-side and CDN caching before any other fix. |
| Use both lab and field data | Cross-reference Lighthouse lab results with CrUX field data at the 75th percentile before declaring any fix complete. |
| Follow the four-step cycle | Baseline, diagnose, fix, re-test: make one grouped change at a time and verify with field data over 28 days. |
| Embed monitoring in governance | Set KPI thresholds for LCP, INP, CLS, and cache hit ratio; review monthly and run synthetic checks daily. |
| Marzipan’s approach | Marzipan frames performance work as an ongoing managed service, combining audits, remediation, and monitoring with accessibility and sustainability criteria. |
Performance as stewardship, not a project
Performance work is most effective when it is treated as a continuous service discipline rather than a one-off project. The organisations that maintain strong Core Web Vitals scores over time are those that have embedded measurement into their release process, assigned clear ownership of the monitoring dashboard, and set a cadence for reviewing field data against the baseline.
For mission-driven organisations in Australia, the framing matters. A faster, lighter website is not just a technical achievement. It is a more accessible service for visitors on slower connections, a lower-carbon digital presence, and a more credible representation of an organisation that takes its digital stewardship seriously. Those outcomes are worth reporting to boards and funders alongside the technical metrics.
Marzipan works with purpose-driven organisations to build and maintain websites that hold their performance over time, not just at launch. The work typically begins with a structured audit, moves through a prioritised remediation sprint, and continues with ongoing monitoring and scheduled assessments. Author bio, case studies, and client proof points are available on request for organisations evaluating agency support.
Marzipan’s performance and web services for Australian organisations

Marzipan offers performance audits, monitoring setup, remediation sprints, and ongoing managed support for Australian charities, government agencies, and purpose-driven organisations. Every engagement starts with a structured baseline audit that covers Core Web Vitals, accessibility, and sustainability criteria together, so fixes address the full picture rather than chasing a single score.
The practical difference from a standard agency engagement: Marzipan frames performance as part of an ongoing search visibility service, not a standalone project. That means your site’s speed, accessibility, and SEO health are monitored and maintained together, with governance reporting that gives your leadership team auditable evidence of improvement over time.
To start, request a discovery audit. Marzipan will assess your current Core Web Vitals, identify the highest-impact fixes, and outline a prioritised remediation plan with realistic timelines and effort estimates. The process is designed to fit within the procurement and governance requirements of high-trust Australian organisations.
Useful sources and tools for further reading
The following sources are referenced in this article and are recommended for further reading.
- Google PageSpeed Insights: free lab and field audit tool; the starting point for any performance review.
- WebPageTest: waterfall analysis with Australian test nodes; use for deep diagnostic work.
- GTmetrix: scheduled monitoring and before/after comparison; useful for tracking changes over time.
- Google Search Console Core Web Vitals report: real-user field data via CrUX; the authoritative source for 75th-percentile LCP, INP, and CLS.
- Digital Service Standard Version 2.0: Australian government baseline and performance indicator requirements.
- Digital Performance Standard: mechanism for consistent monitoring and data-driven improvement in Australian government digital services.
- GovCMS website best practice: iterative performance and optimisation guidance for Australian government CMS users.
- Queensland Government online file optimisation standards: asset optimisation requirements for government web publishing.
- ACCC Measuring Broadband Australia Web Performance Report: evidence that site design and object count outweigh connection speed as performance drivers.
- Marzipan sustainable web design guide: practical techniques for reducing page weight and environmental impact.


